Good news everyone: I have some data on COVID-19, and analysis will surely follow
Keeping Up with COVID
These past few weeks, I have been down with COVID-19. I was one of the few I know who hadn’t had it up until now. And… of course while I was isolating I needed something to do. So, I gathered some data from Johns Hopkins (JHU) and the Department of Health and Human Services (HHS) so that I could run some analyses of my own in the future. I didn’t get too far, but I definitely got to clean some data, practice my R skills, and lay the groundwork for more interesting things to come in the future.
I hope to build on this, and in the future to be able to provide projections, scenarios, and potentially forecasts for COVID-19, and other respiratory illnesses, so I can potentially provide some insight for what’s going on here locally in Oklahoma.
So, welcome to my new side project! It’s not much now, but I will be sure to work at improving it in the future.
So Far, So Good
So far, I haven’t been able to really do much besides clean the data and chart incidence and hospitalizations for the last week. I also plan on making them more colorful and interactive in the future (using a cool R package called plotly - for now just using ggplot):
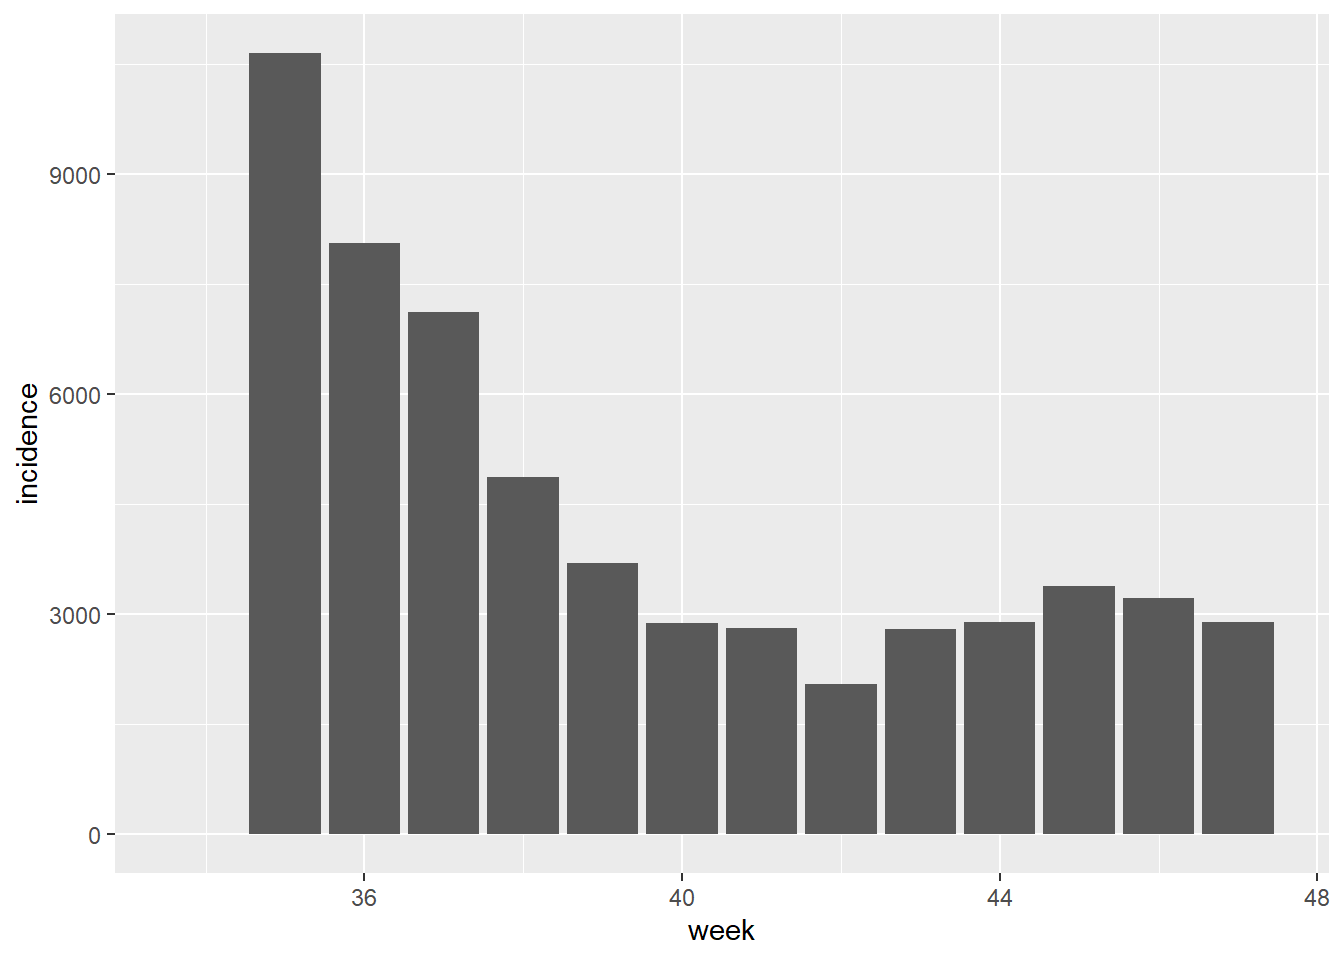
Weekly Incidence
The chart below shows the number of cases per week, for the last three months, in Oklahoma as a state:
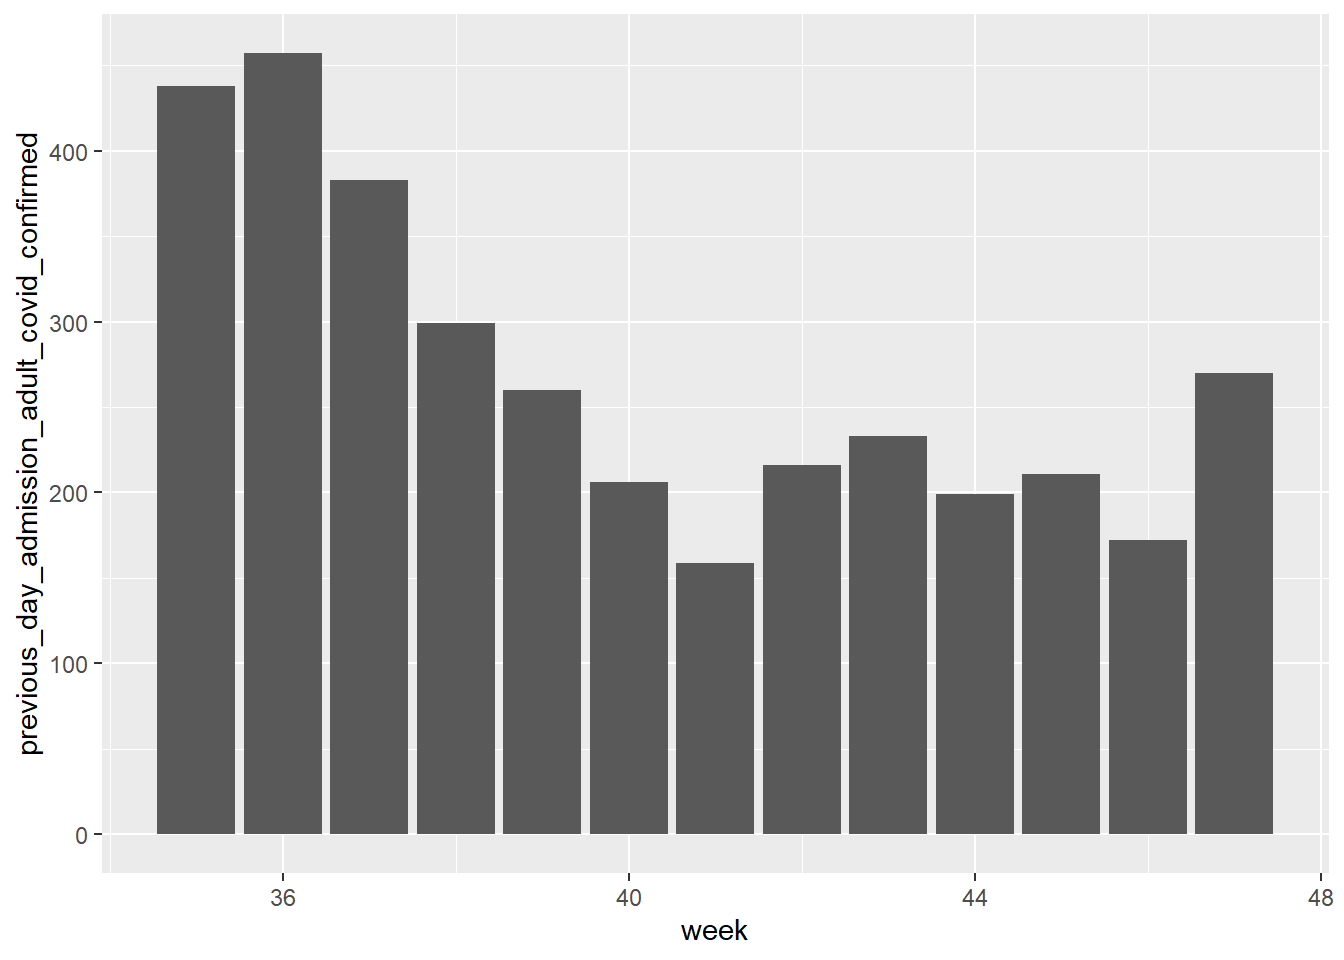
Weekly Hospitalizations
The chart below shows the number of adult hospital admissions per week, for the last three months, in Oklahoma as a state:
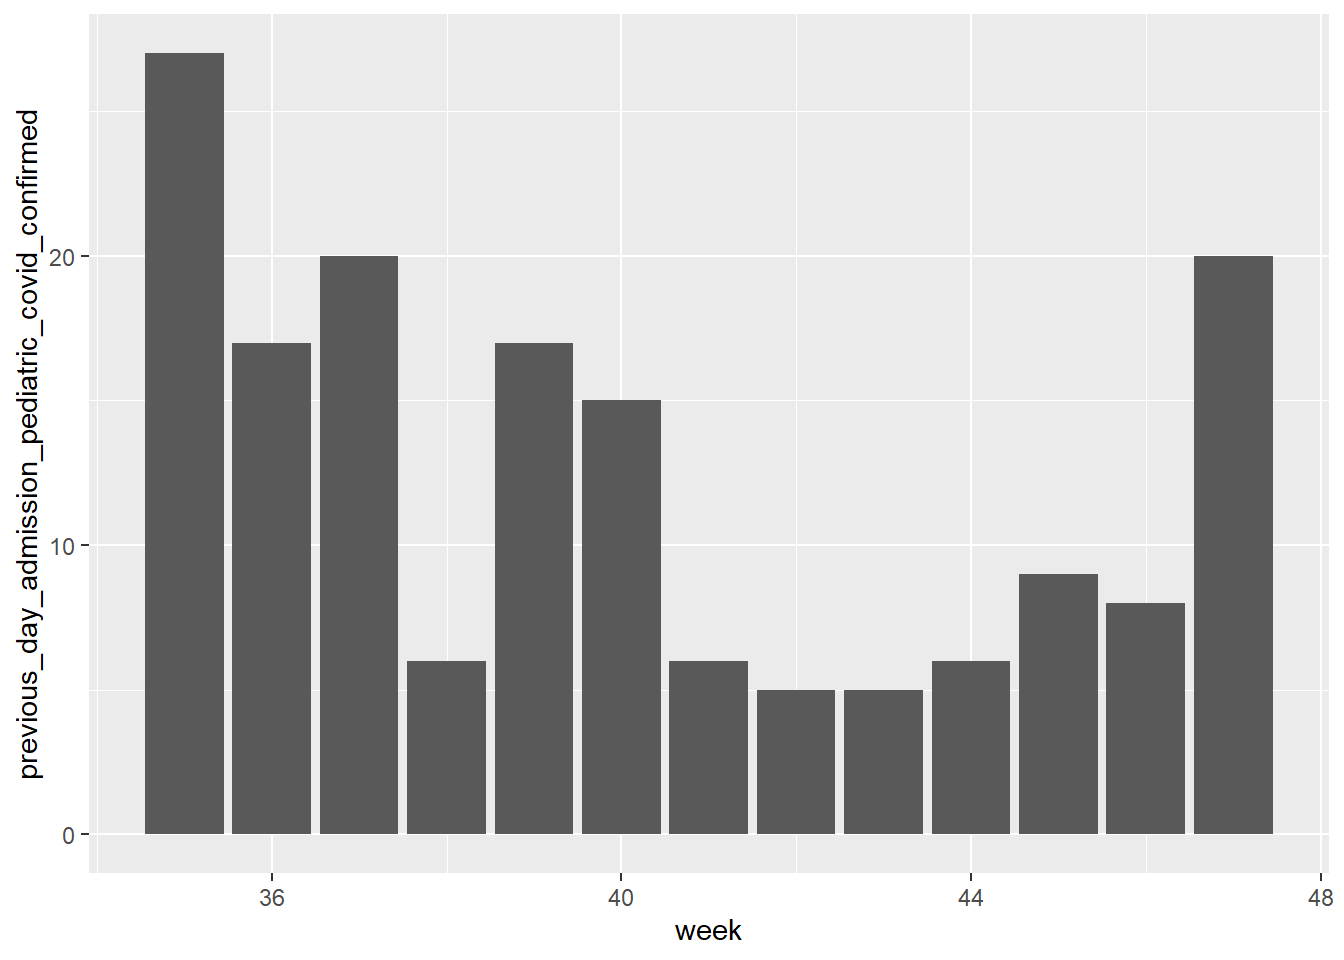
The chart below shows the number of pediatric hospital admissions per week, for the last three months, in Oklahoma as a state:
What Do I Think These Charts Mean?
What we can tell from these charts is only so much, but in the past week it looks like we had an increase in hospitalizations in adults and children, while reported cases remained low. Of the possible explanations, two are most likely: A) there are a lot more people with COVID-19 than are being reported, and B) cases could be more likely to result in hospitalization than in the past month and a half.
Concerning A) - this makes sense, because most people would probably take an over-the-counter rapid antigen test if they wanted to be tested for SARS-CoV-2. They may also forget that the final step is to call in to your primary care provider and let them know if you have a positive result. Essentially, we could have more cases in the state than what is being reported, if the number of true cases is tending to maintain proportionality to hospitalizations.
Concerning B) - it’s also possible that newer strains of SARS-CoV-2 are circulating and simply are more likely to result in hospitalization. If we take the reported data to be mostly accurate at face value, this is the most likely scenario.
Ultimately though, there are two things to keep in mind - this isn’t an established trend yet, but also by the time we see a trend established it would be too late to do anything about it. Diseases grow in an exponential fashion, meaning this is to be expected if things were to be ramping up. The good news though, is that these numbers are pretty small, relatively speaking, and hospitals are currently about at 2/3 capacity in the state.
Putting it All Together
It’s no surprise that we’re beginning to see hospitalizations increase a little, and most people probably are expecting winter - traditionally flu/respiratory disease season - but we don’t want things to get out of control. It’s too early for me to say much other than I would start to take a few more precautions, like wearing a mask in public or washing my hands more. We won’t be able to keep everyone out of the hospital, but we can do our part to lower the number of people that end up there.
I also have to say, I am up to date on all my boosters, even the new one, and I still just had my first bout of COVID-19. I wasn’t hospitalized, and I believe I’m not a long-haul case, and those outcomes were more likely if I wasn’t vaccinated. However, I still had COVID-19 and I think it’s important to understand that newer strains can be unpredictable. I would reduce my risk of spreading COVID-19 to others by wearing a mask in public, even if I’m vaccinated - and now have naturally acquired immunity.
About the Data
The case data is from John’s Hopkins - their CSSE group uses essentially the same data that is reported from Oklahoma to the CDC, and they have assisted the CDC with collecting data since the start of the COVID-19 pandemic. You can find the data and more information at their github website here; their resource center is also a great source of information.
The hospitalization data is from HealthData.gov. You can find the repository here.